Product Portfolio
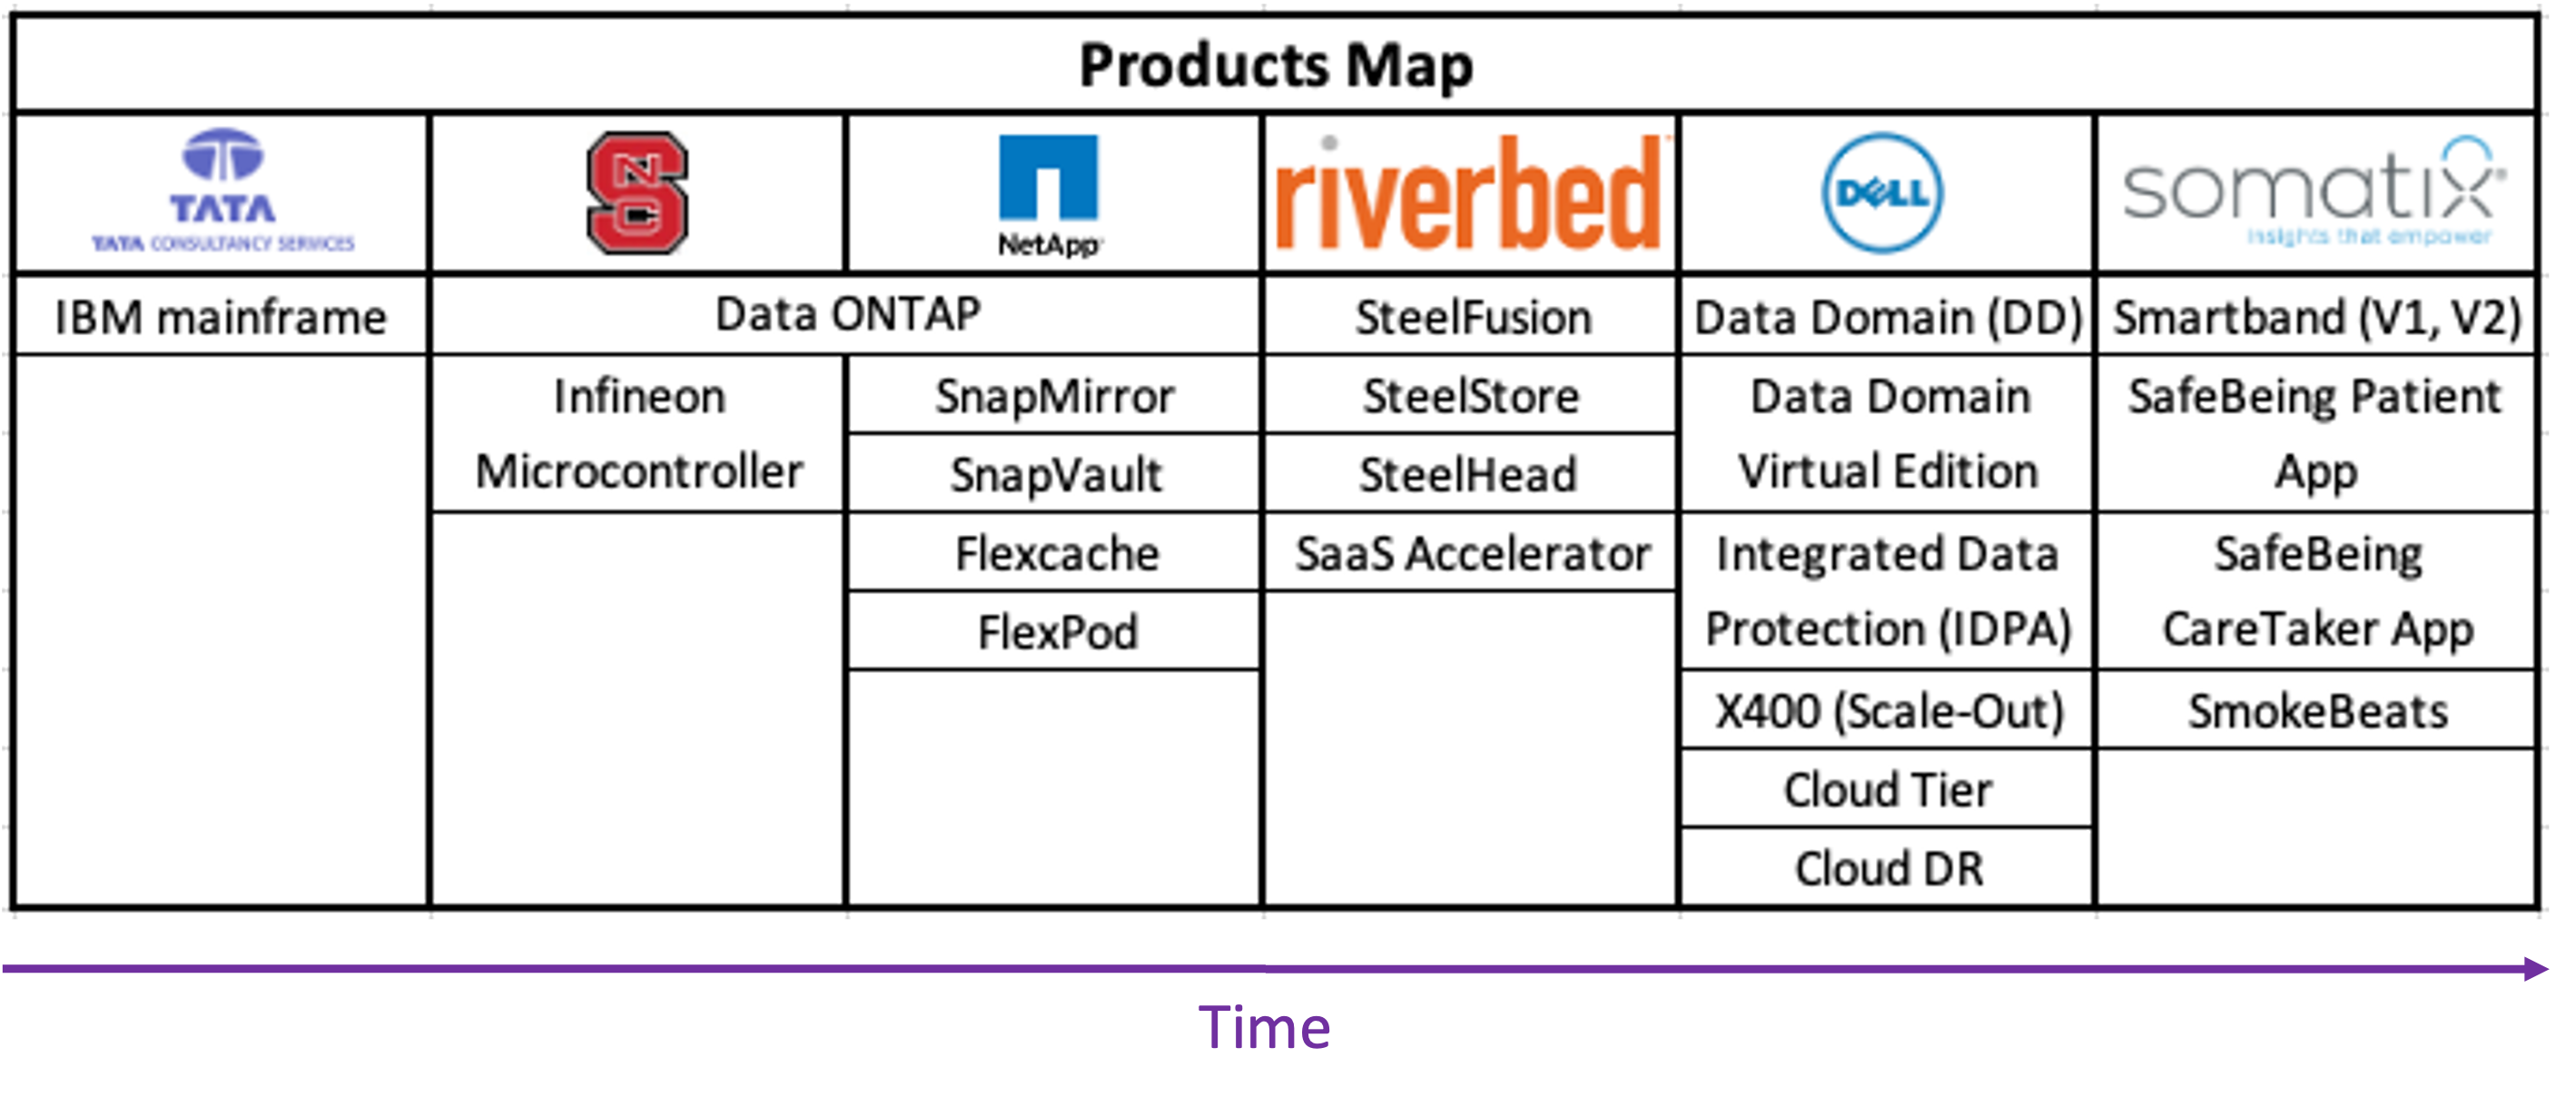
Here is a list of Software and Hardware products both in the Enterprise and Consumer space that I had the pleasure to work on throughout my career.Somatix's HealthTech Products
Somatix's SafeBeing and SmokeBeatDell EMC's Data Protection Products

PowerProtect DD Appliances (industry's #1 Purpose-Built Backup Appliance)Dell EMC Integrated Data Protection Appliances (IDPA)
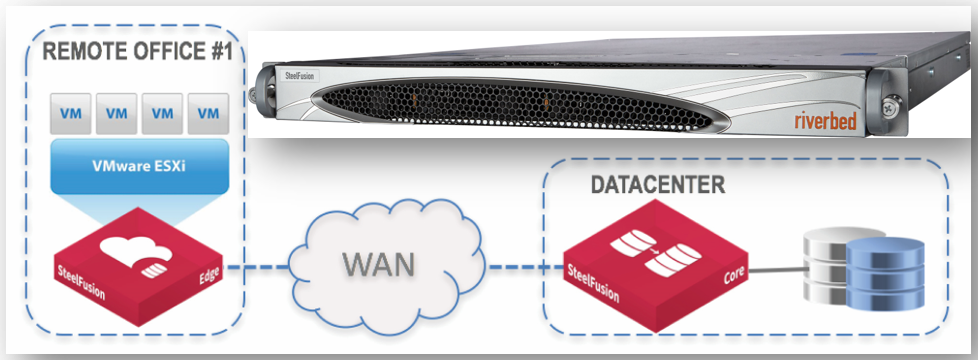
Riverbed Tehnology's first and only Software-Defined Edge Solution (SteelFusion)
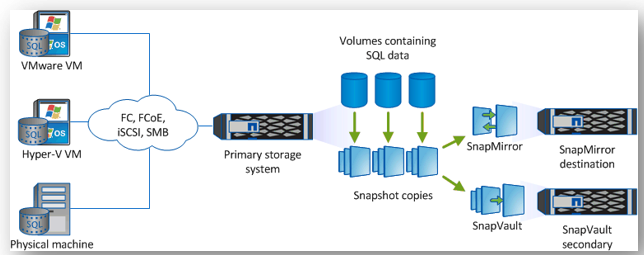
NetApp's Data Protection Products (SnapMirror and SnapVault)
Visualization Portfolio
Links to download my Visualization and Analytics Portfolio - linkVisualization Collage
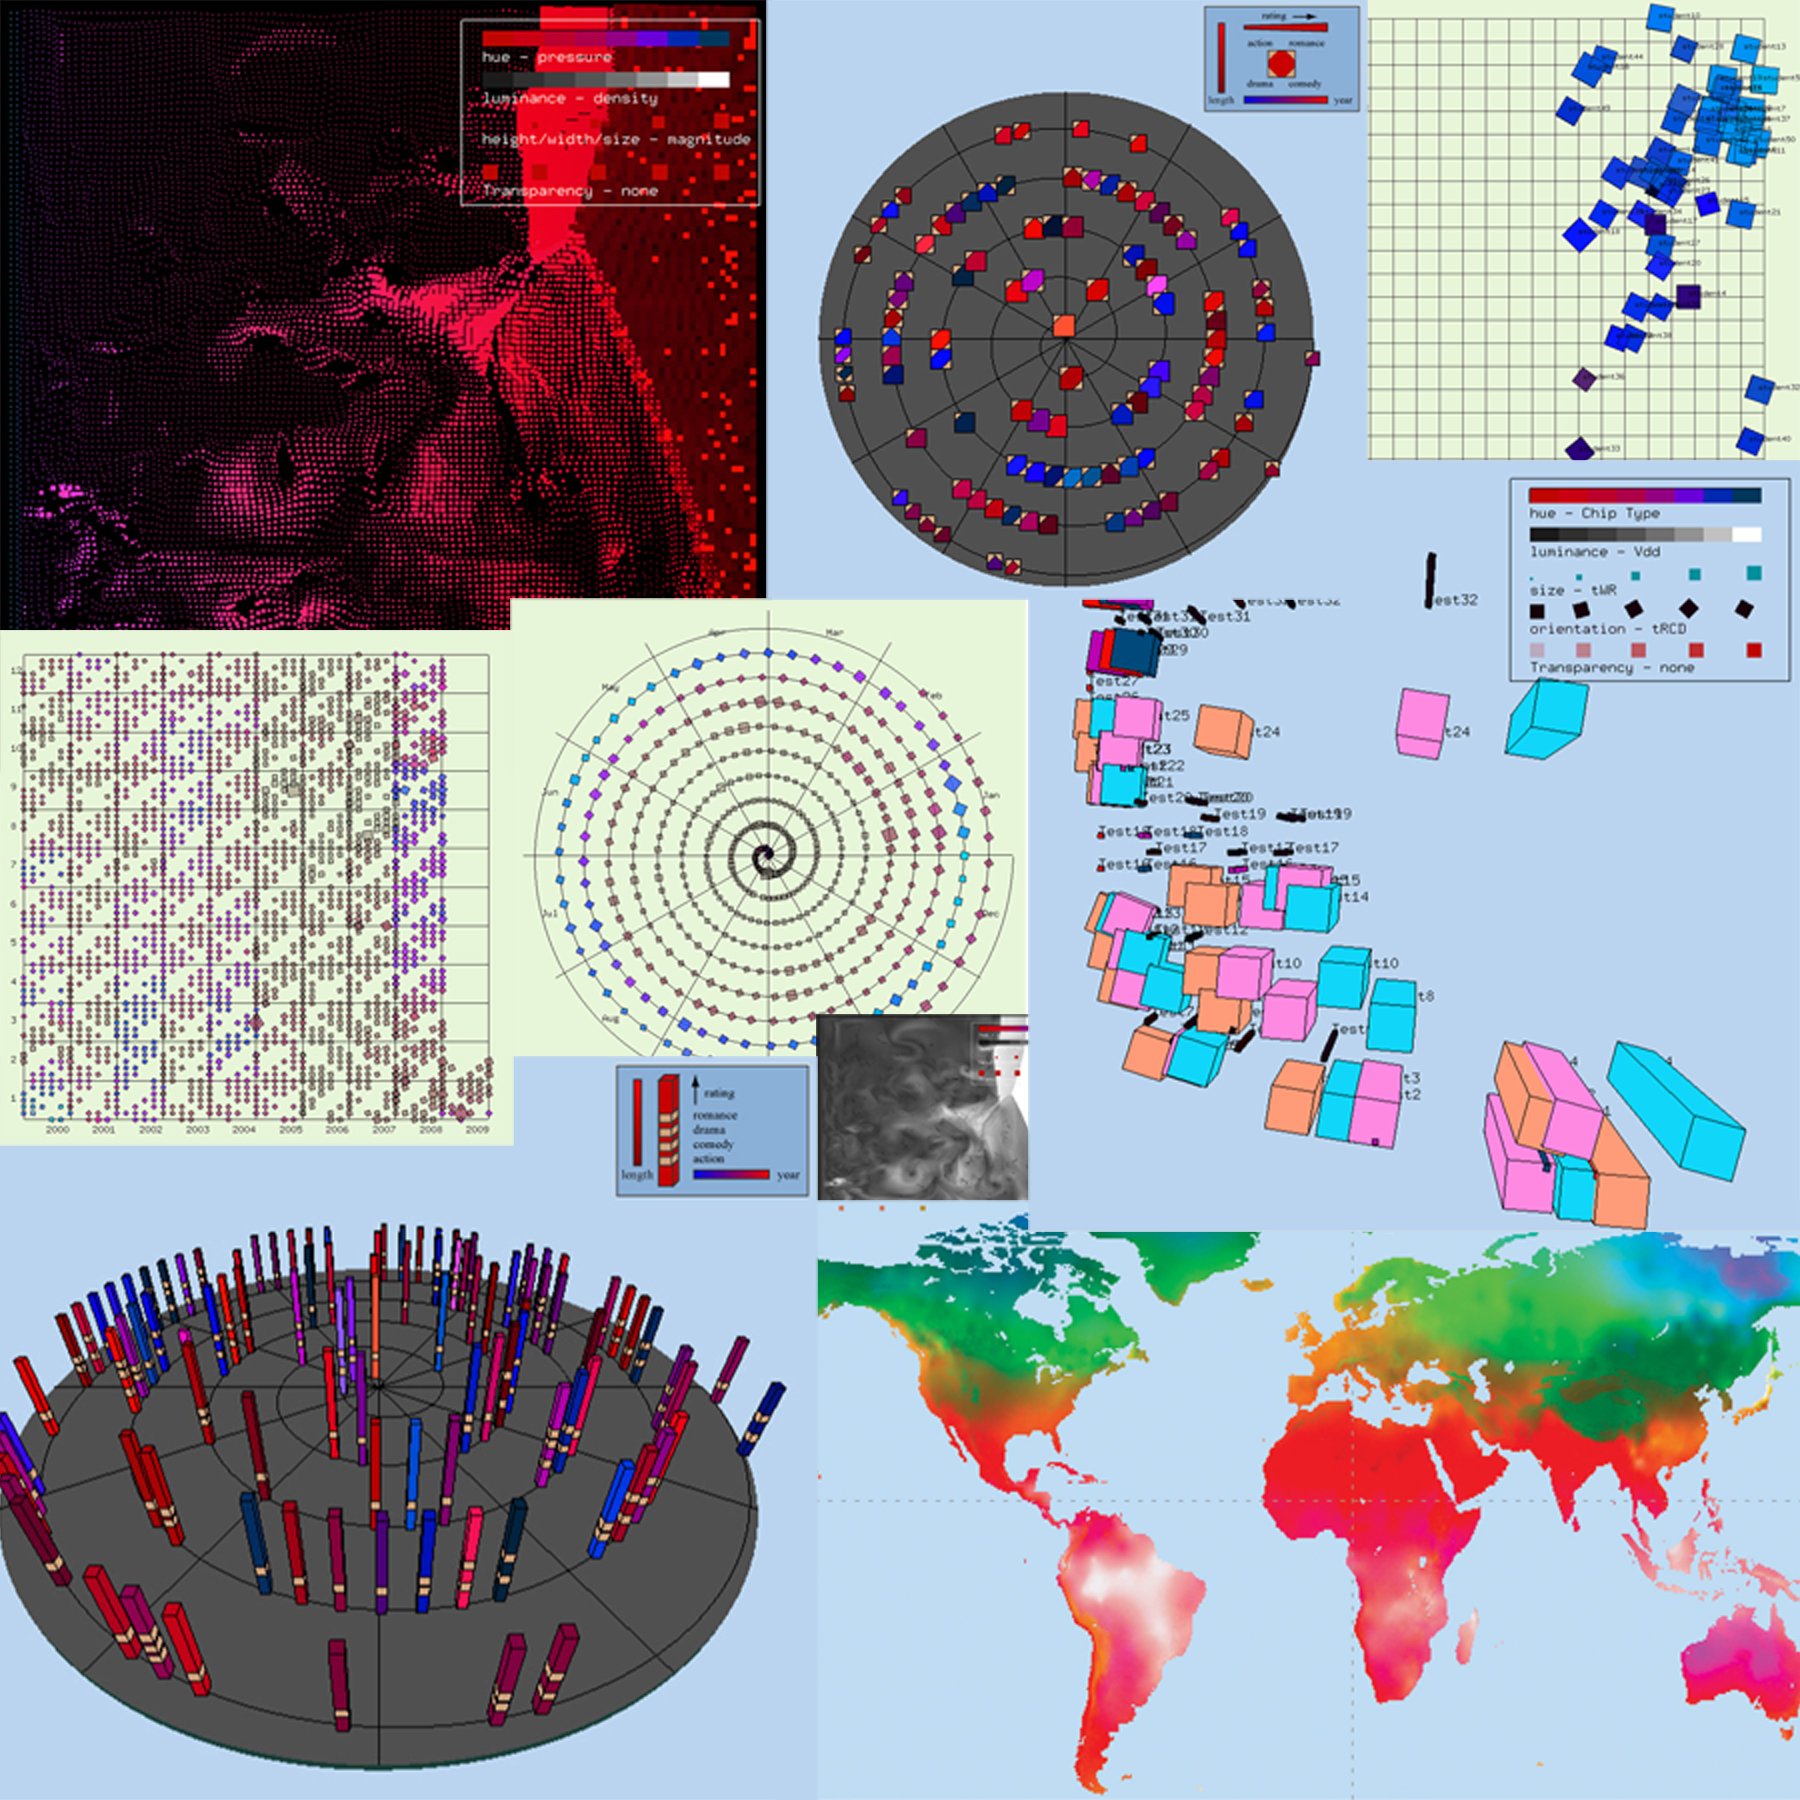
My primary interest is computer graphics and analytics, specifically information visualization and scientific visualization of large, multi-dimensional datasets in ways that allow viewers to rapidly and accurately explore, analyze, compare, validate, monitor, and discover within data. Effective representation of large, complex collections of information (datasets) presents a difficult challenge. Datasets are collections of strings and numbers usually representing measurements or results. Visualization is a solution that uses a visual interface to support efficient analysis and discovery within the data. It presents this information in a pictorial form that a viewer can use to 'see' values, relationships, and structure inherent in the dataset. Common examples of large, multi-dimensional datasets include geographic weather information, astrophysics supernova flow data, and storage server performance metrics. The overwhelming amount of information stored in these datasets makes them difficult to analyze using traditional mathematical or statistical methods.
Bibliography
- Sawant, A. P. (2003). "Dynamic Visualization of the Relationship Between Multiple Representations of an Abstract Information Space," M.S. Thesis, Department of Computer Science, North Carolina State University
- Sawant, A. P. and Healey, C. G. (2006). "Visualizing Abstract Data Using Animation," IEEE Visualization (VIS 2006) Poster Session, Baltimore, Maryland, pp. 37-38
- Sawant, A. P. and Vanninen, M. (2006). "Visualization of Storage Controller Performance Data," ACM/IEEE SuperComputing (SC 2006) Poster Session, Tampa, Florida, pp. 187
- Sawant, A. P. (2007). "Perceptual Display Hierarchies for Visualization," Ph.D. Dissertation, Department of Computer Science, North Carolina State University
- Sawant, A. P. and Healey, C. G. (2007). "Visualizing Flow Data Using Assorted Glyphs," ACM Crossroads, Winter 2007, 14, 2, pp. 3-7
- Sawant, A. P., Raina, R., and Healey, C. G. (2007). "ChipViz: Visualizing Memory Chip Test Data," Proceedings 3rd International Symposium on Visual Computing (ISVC 2007), Lake Tahoe, Nevada, Vol. 4842, pp. 711-720
- Sawant, A. P., Vanninen, M., and Healey, C. G. (2007). "PerfViz: A Visualization Tool for Analyzing, Exploring, and Comparing Storage Controller Performance Data," Proceedings Visualization and Data Analysis (VDA 2007), San Jose, California, Vol. 6495, paper 07, pp. 1-11
- Sawant, A. P. and Bali, N. (2007). "SoftArchViz: A Software Architecture Visualization Tool," Proceedings 4th IEEE International Workshop on Visualizing Software for Understanding and Analysis (VISSOFT 2007) Tool Demonstration, Banff, Canada, Cat. No. 07EX1516C, pp. 154-155
- Bali, N. and Sawant, A. P. (2007). "SoftArchViz: An Automated Approach to Visualizing Software Architectures," Proceedings International Conference on Modeling, Simulation and Visualization Methods (MSV 2007), Las Vegas, Nevada, ISBN 1-60132-029-9, pp. 60-67
- Sawant, A. P. and Bali, N. (2007). "DiffArchViz: A Tool to Visualize Correspondence Between Multiple Representations of a Software Architecture," Proceedings 4th IEEE International Workshop on Visualizing Software for Understanding and Analysis (VISSOFT 2007), Banff, Canada, Cat. No. 07EX1516C, pp. 121-128
- Sawant, A. P. and Larson, P. (2008). "GraphRun: Visual Analysis of Performance Workload Metrics on a Storage Server," Proceedings Computer Measurement Group (CMG 2008), Las Vegas, Nevada, Vol. 2, pp. 705-715
- Sawant, A. P. and Bali, N. (2008). "MultiVizArch: Multiple Graphical Layouts for Visualizing Software Architecture," ACM Crossroads, Spring 2008, 14, 3, pp. 17-21
- Sawant, A. P. and Healey, C. G. (2008). "Visualizing Multi-dimensional Query Results Using Animation," Proceedings Visualization and Data Analysis (VDA 2008), San Jose, California, Vol. 6809, paper 04, pp. 1-12
- Sawant, A. P., Healey, C. G., Chen, D., and Chirkova, R. (2009). "AmazonViz: Visualizing Amazon.com Purchase Orders," ACM Crossroads, Spring 2009, 15, 3, pp. 13-17
- Sawant, A. P. (2009). "StockViz: Analyzing the Trend of Stocks in Major Auto, Oil, Consumer, and Technology Companies," Proceedings International Conference on Modeling, Simulation and Visualization Methods (MSV 2009), Las Vegas, Nevada, ISBN 1-60132-120-1, pp. 278-284
- Sawant, A. P. (2010). "GradeViz: Interactive Visual Representation of Student Grades," Proceedings International Conference on Frontiers in Education: Computer Science and Computer Engineering (FECS 2010), Las Vegas, Nevada
- Sawant, A. P. (2011). "A Visualization Approach Towards Analyzing and Correlating FORTUNE 100 Stocks," Proceedings International Conference on Advanced Data Analysis, Business Analytics and Intelligence (ICADABAI 2011), Indian Institute of Management, Ahmedabad, India
- Sawant, A. P., and Healey, C. G. (2012). “On the Limits of Resolution and Visual Angle in Visualization,” ACM Transactions On Applied Perception, 9, 4, 20, pp. 1-21